Debugging

What is a code bug?
What is a bug? 🐛 A bug is an error, flaw, or fault in a computer program that causes it to produce incorrect or unexpected results, or to behave in unintended ways. Essentially, something that is not working as expected is called a "🐛"!
Example:
Say you expect a program to add two numbers, the code in Javascript would look something like the below (which has a bug)
function addNumbers(a, b) {
  // Subtracts the numbers instead of adding them which is a bug
  return a - b;
}
In the above code, the bug is that instead of the "+" operator to add two numbers, we have used the "-" operator which subtracts them instead. I know, I know, we haven't gotten to understand all the syntax and the "rules of the language", just yet, but, I believe the above chunk of code was easy to understand, right?
Essentially, there is a function, a function is a utility that handles a particular task. Just like in construction, you have an excavator to dig and move earth, while a truck would carry the load from point A to B, in code as well we have multiple "tools" we can use to achieve certain things. Here function is a utility that can do "something", a certain task, here, its task was to add two numbers. But it instead subtracts them, hence a bug in the function.
What is a browser developer console?
A browser console is a tool provided by web browsers for developers to debug and interact with web pages. It allows developers to execute JavaScript commands, log messages, and inspect the Document Object Model (DOM). More about the DOM is taught in future sections, for now, imagine that it is like the backbone of a webpage, the structure that renders on the screen.
A console gives us real-time feedback, i.e. we can see the errors as and when they occur, which is amazing, isn't it? Being able to identify the bug is the root step, the core to being able to solve a problem. Imagine this step to be like the diagnosis when we visit the doctor. Say we have pain in the hand, and we visit the doctor, somethings the doctor might ask would be, "Have you injured yourself?", "Have you met with any accidents?", the doctor might also request for an x-ray examination to understand more, in computer science terms, "get more data" to understand the issue, right? Similarly, in code, we look at the errors, in the console, during run-time, i.e. as the code is run, to check and identify the root cause of the problem - x-ray for the code, if I may!
How to open the console in the top browsers?
Let's discuss about the main browsers / most common browsers and how to view the console in them:
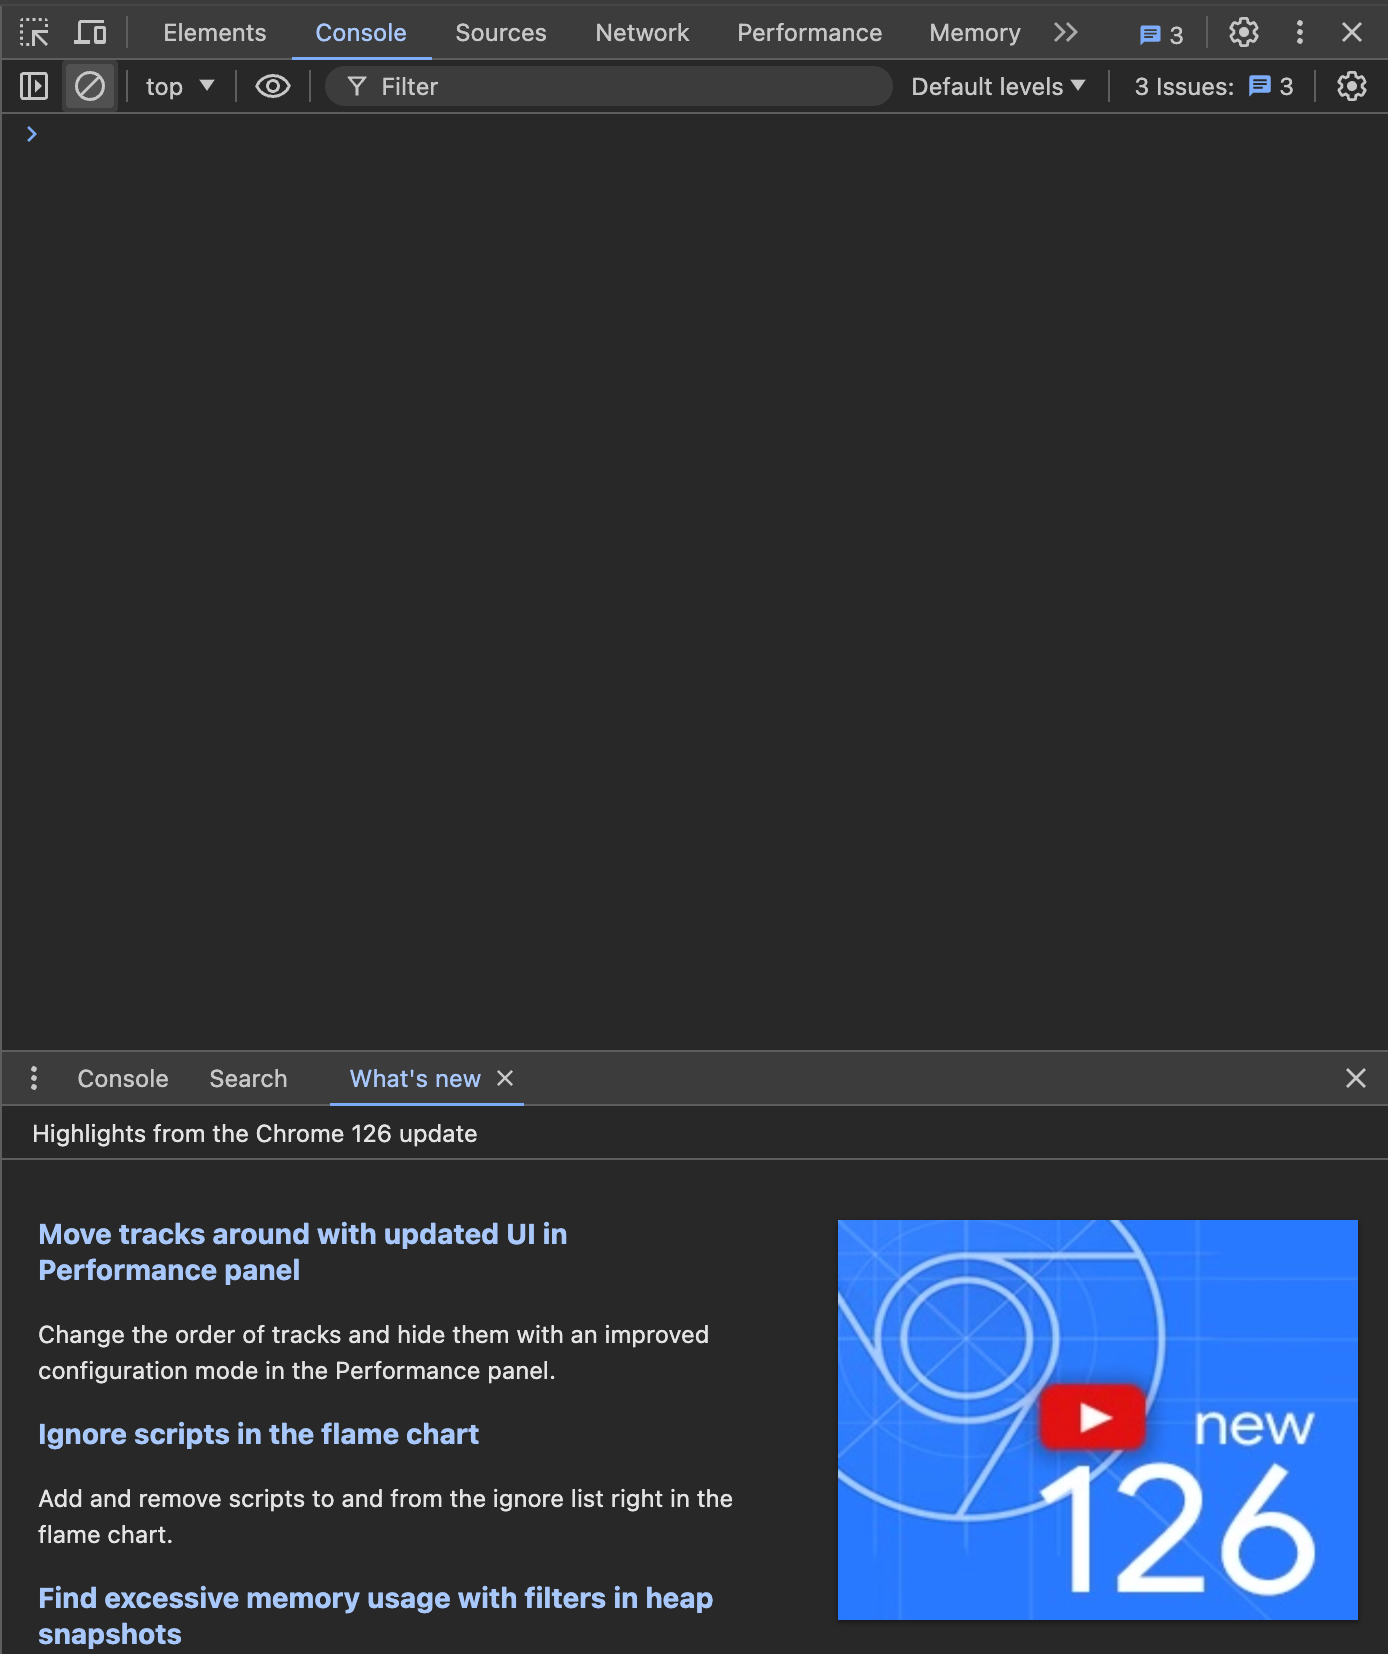
Google Chrome:
To open the console on Google Chrome, use the F12 key on your keyboard.
The console should look like the below:
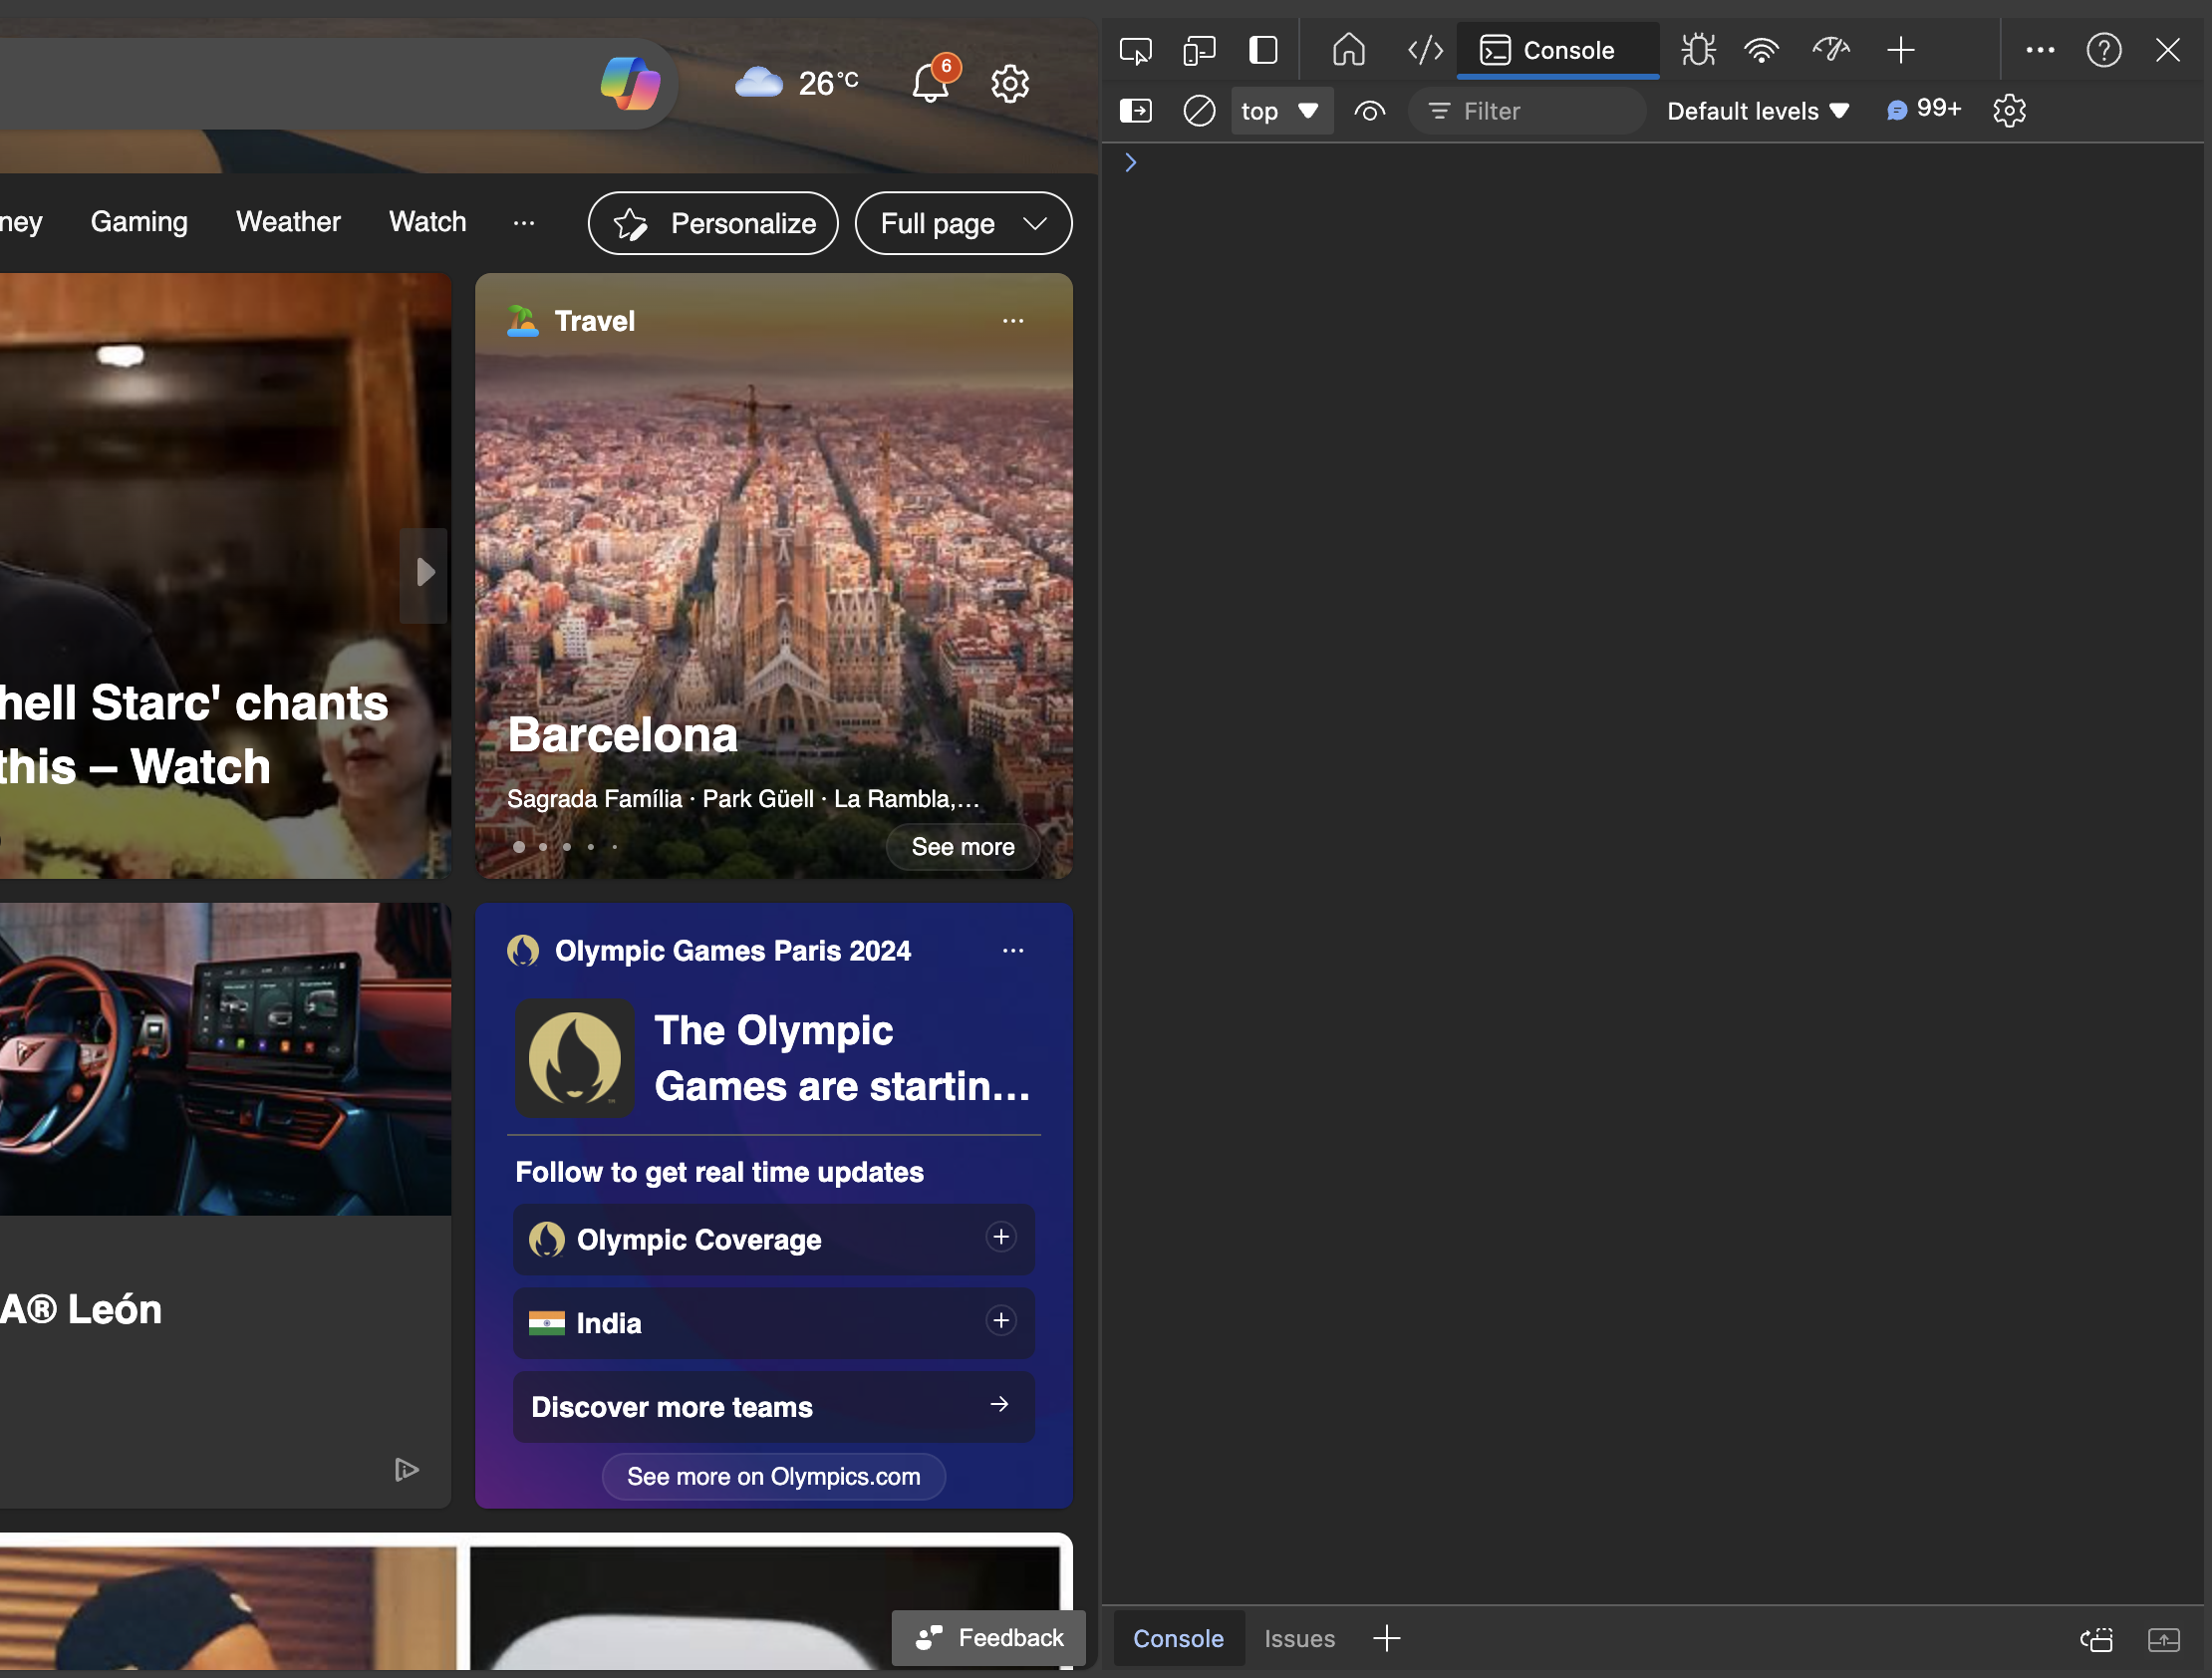
Microsoft Edge:
To open the console in Microsoft Edge, use the command Control + Shift + C on a Windows machine and Cmd + Shift + C on a Mac.
The console should look like the below:
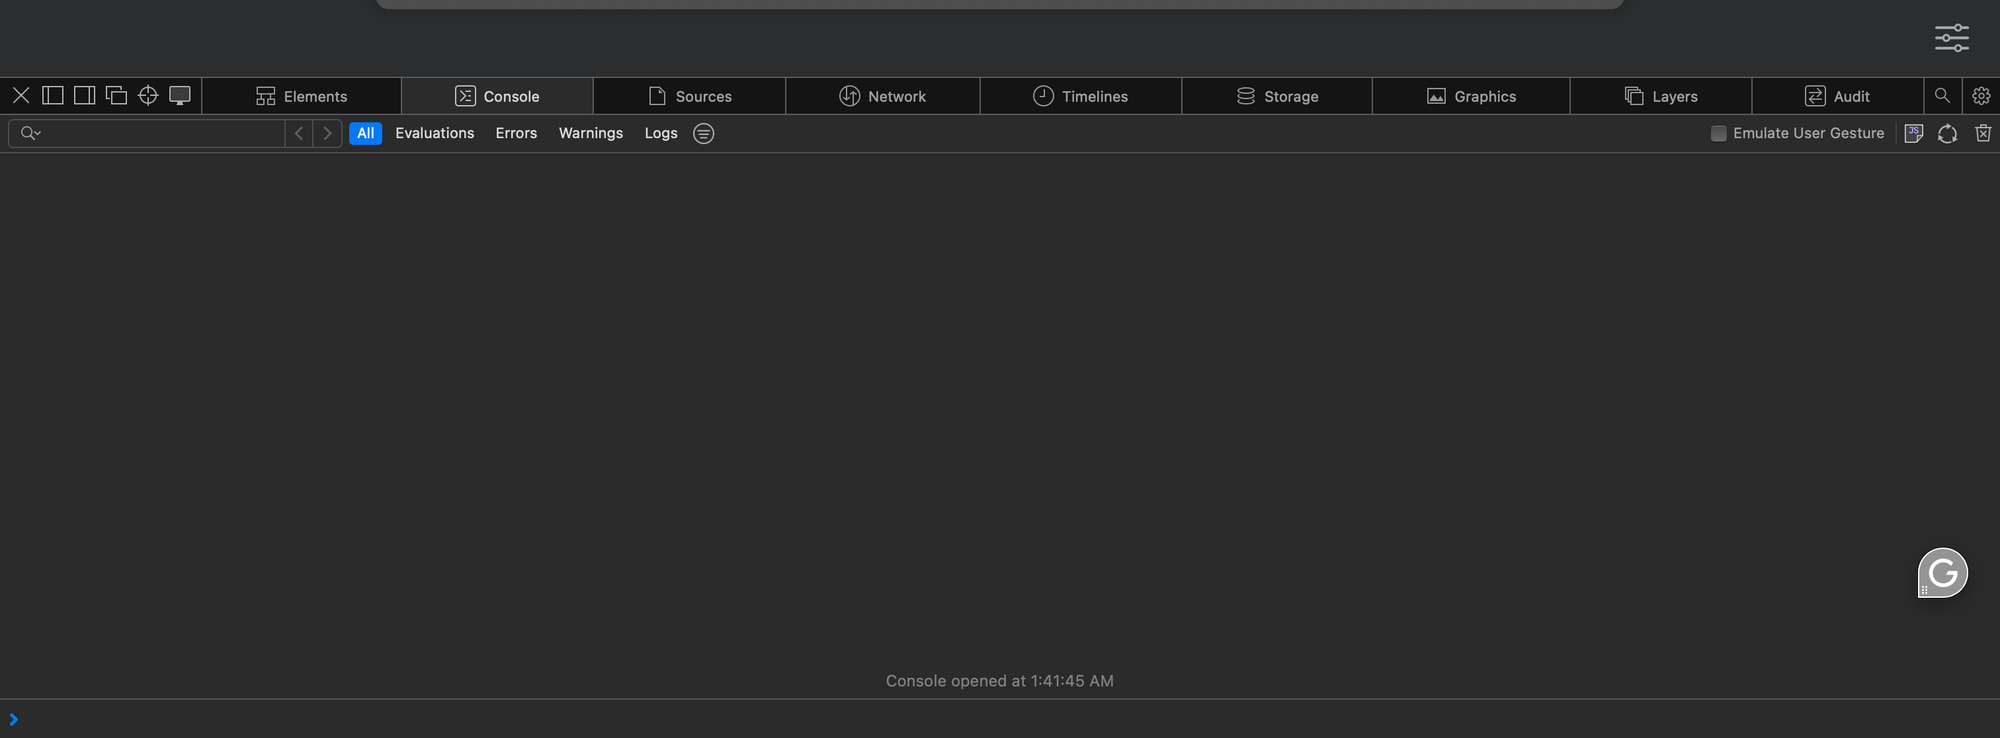
Apple Safari:
Opening up the console is not a one-step-process in Safari!
To open up the console,
- Click on the "safari" option on the top and click on settings.
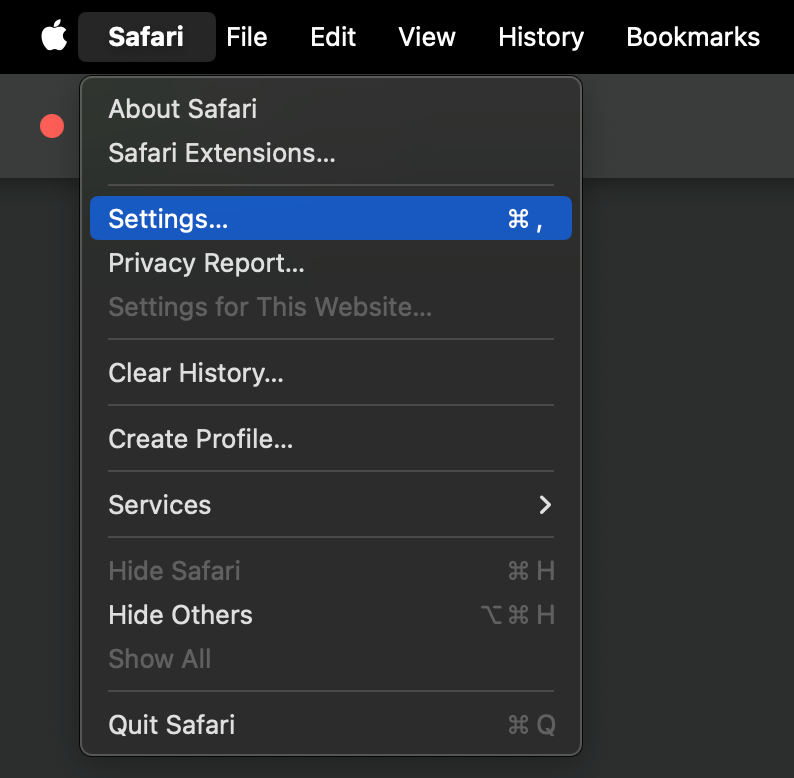
- Next, under the "Advanced" tab, check the checkmark that says "Show features for web developers"
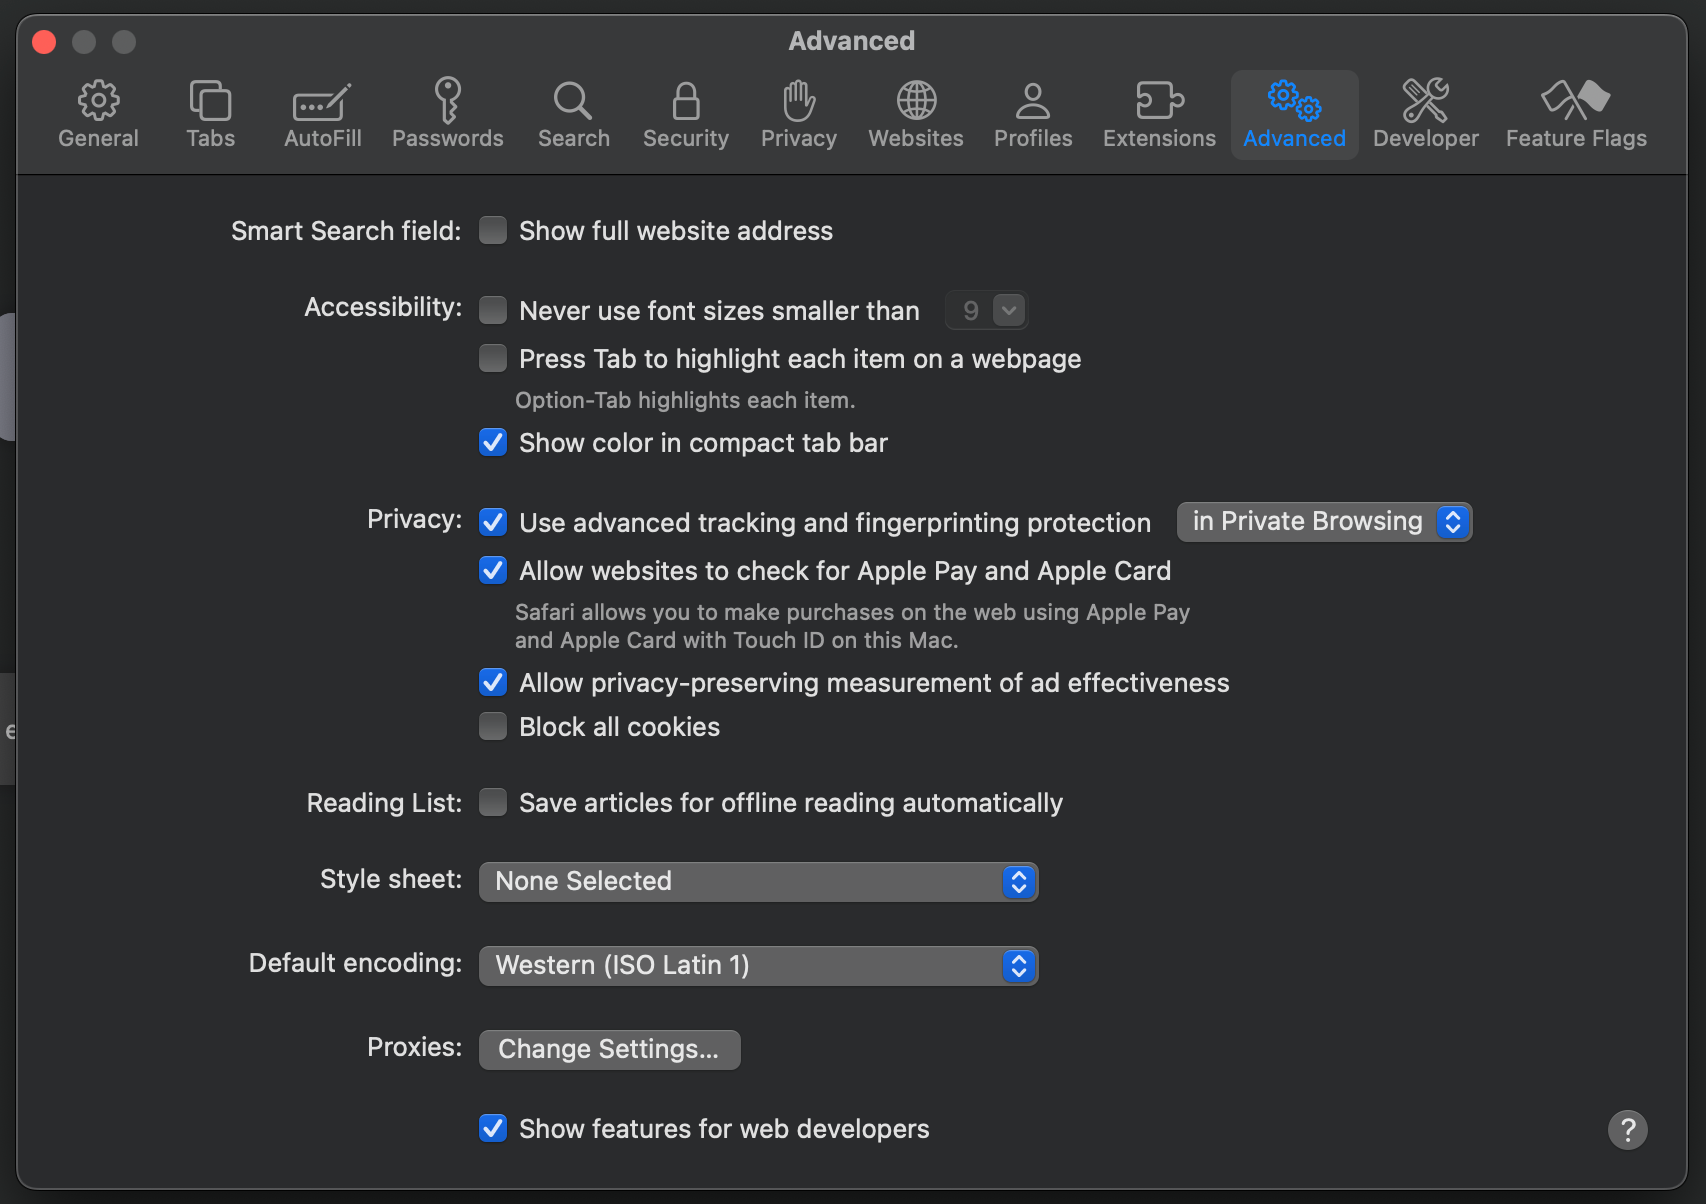
Now the nav bar at the top will have the "Developer" and "Feature flags" options enabled as well.
Now, press cmd + option + C to open the console.
The console should look as the below ( could vary slightly at the time of reading this article )
( Note: I would recommend using Chrome or Edge for development since they are very developer-friendly and are most commonly used in the market)
What does the developer console have?
( Note, the screenshots in this section are of Google Chrome, but the same can be seen in all/ most of the browsers. )
The developer tab/tool is bundled with a ton of things, some of the most important ones are:
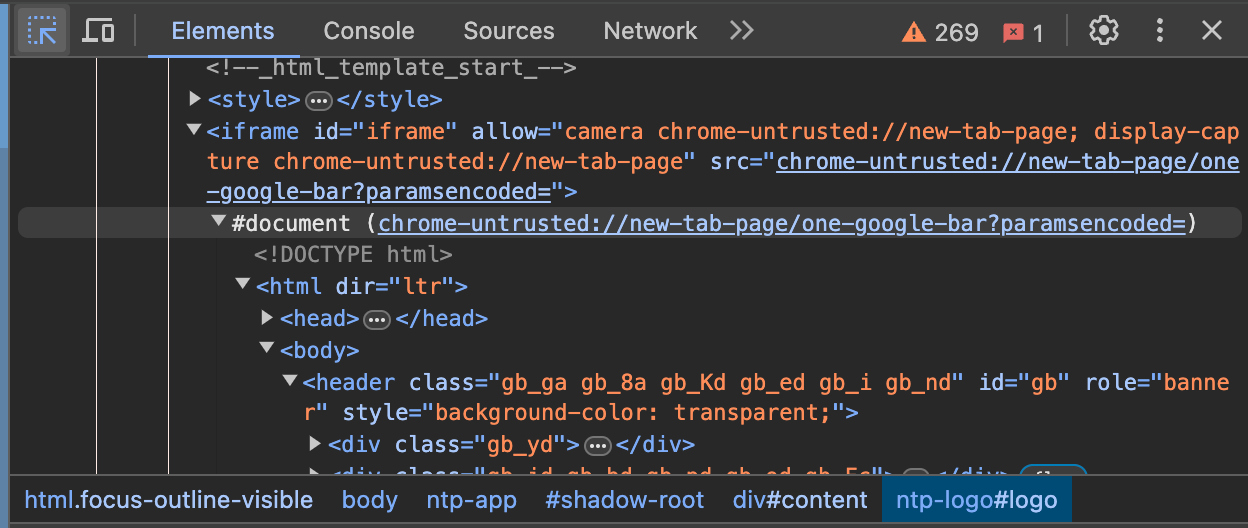
- Selector & Elements - Viewing the DOM elements, essentially the HTML tags that are rendered can be viewed here. Essentially it displays the HTML and CSS structure of the webpage, allowing you to inspect and edit the DOM. The blue arrow at the left top allows us to select the element, as in pick and choose on the window and then the corresponding element can be seen as below.
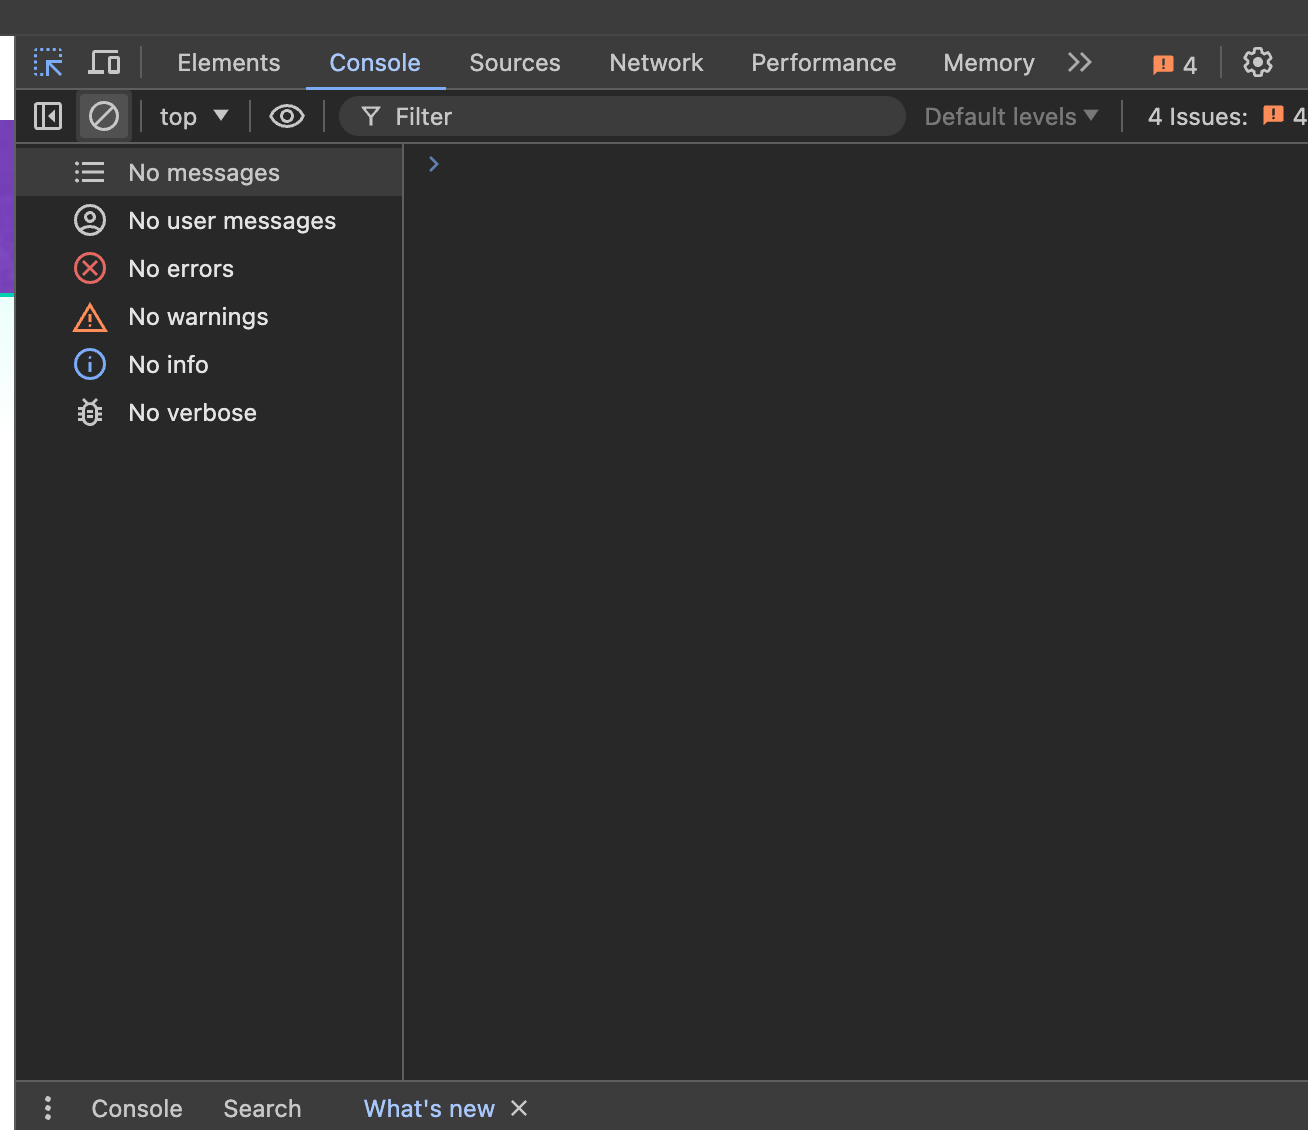
- Console: Shows messages logged by the JavaScript code, including errors, warnings, and custom logs. We can add some JS code right on the console as well and run it. We use the console to print the console.log()s from the code, this helps find the state of the code in certain cases, also helps us log results or read warnings. Also, this is where we see the code errors, the run time errors in the code, etc. You are going to be using this extensively as a front-end engineer, better say "Hi" and be good friends with the console!
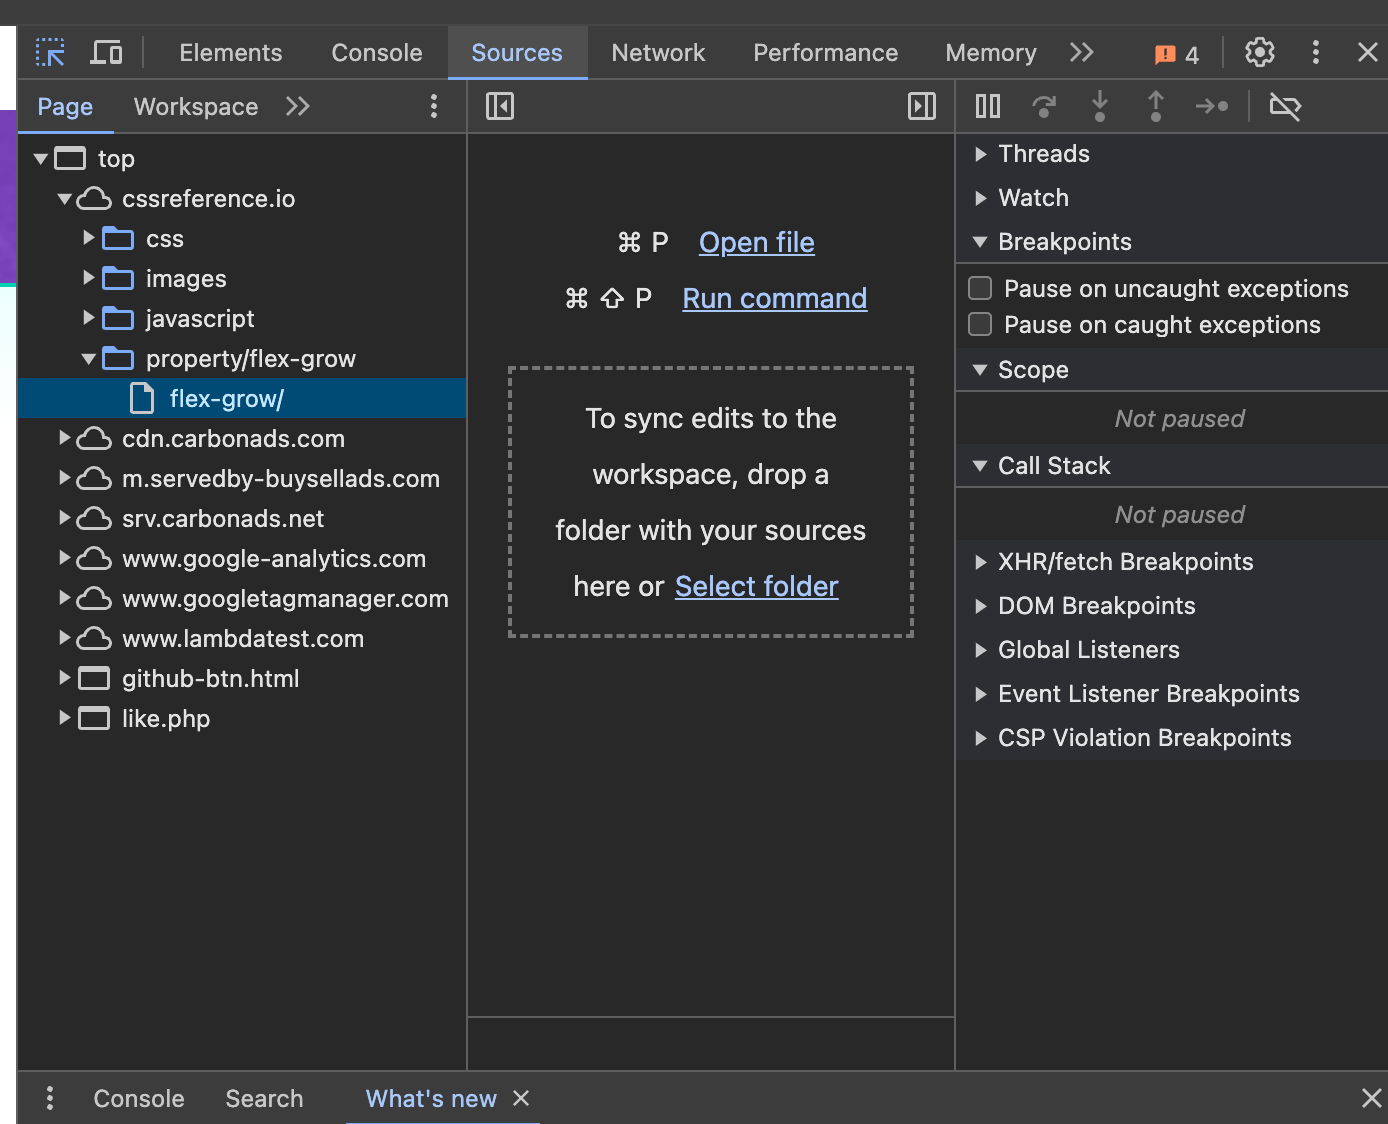
- Sources: Provides access to the site's JavaScript files, enabling us to set breakpoints and debug code. It helps us in a way play and pause the code in a way, that means, the code execution stops, rather, pauses until the user chooses to continue, breakpoint is just like a pause button, the code stops executing at that point, allowing us to view the code and the status of the code to debug the issue, i.e. find the errors.
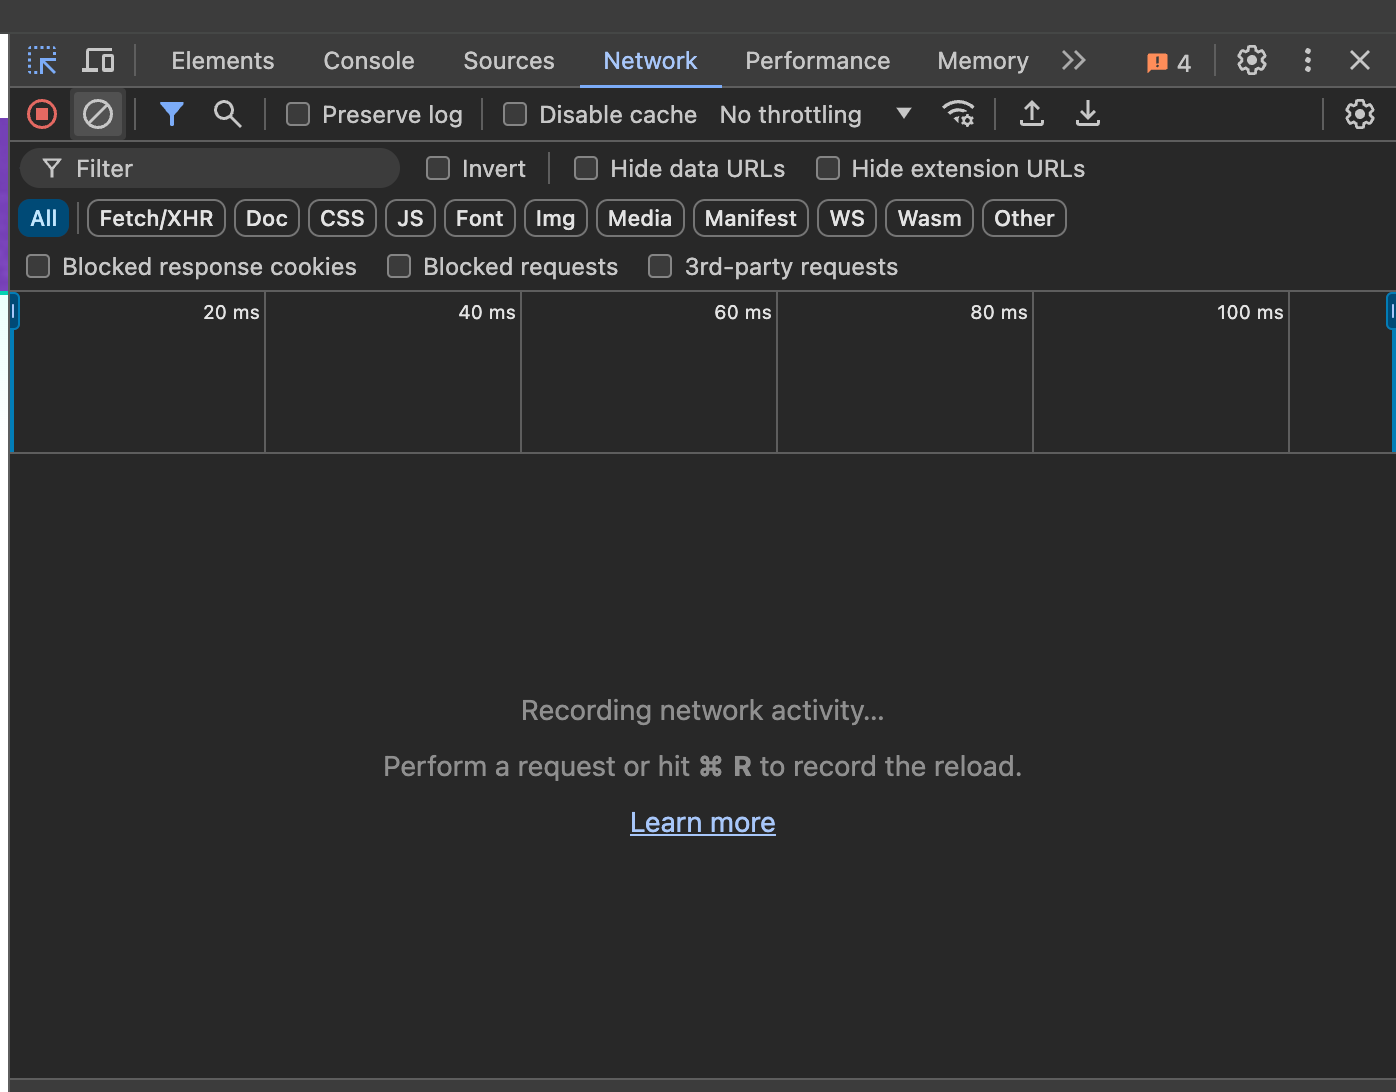
- Network: Monitors network activity, showing details about requests and responses for resources like files and data. This is where we get to see the API calls, don't worry about this for now, but understand that, this is how we see the data from the back-end on the browser. More on this later. If you for example go to the Amazon website and open the developer tools and check the network, you will able to see the API calls that it made to the back-end to get the data, such as products.
Great, that is all we need to understand ( for now ) about the developer tools and the console. I hope you are having fun learning Front-end! Keep the "Josh" and I will see you in the next one!